-
install.packages("tidyverse")
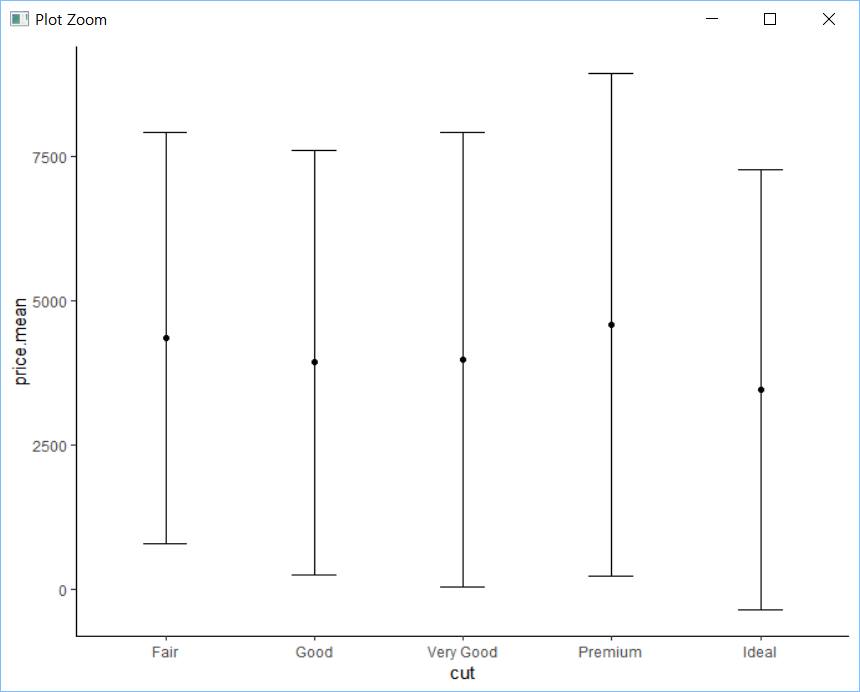
library(tidyverse)diamonds %>%
dplyr::group_by(cut) %>%
dplyr::summarise(price.mean = mean(price),
price.sd = sd(price)) %>%
ggplot2::ggplot(mapping = aes(x = cut, y = price.mean)) +
geom_point() +
geom_errorbar(mapping = aes(ymin = price.mean - price.sd, ymax = price.mean + price.sd),
width = 0.3) +
theme_classic()
'R' 카테고리의 다른 글
Edward Tufte의 데이터 시각화의 원칙 (0) 2019.07.11 XGBoost 설명 (0) 2019.04.26 matrixStats: Summary of functions (0) 2019.03.12 분석할 데이터가 클 때의 해결방법 (0) 2019.01.31 readr 패키지의 함수와 base의 데이터 읽어오기 함수의 비교 (0) 2019.01.19